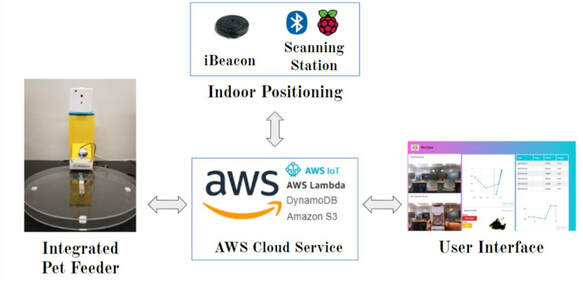
Flow Chart
System Architecture
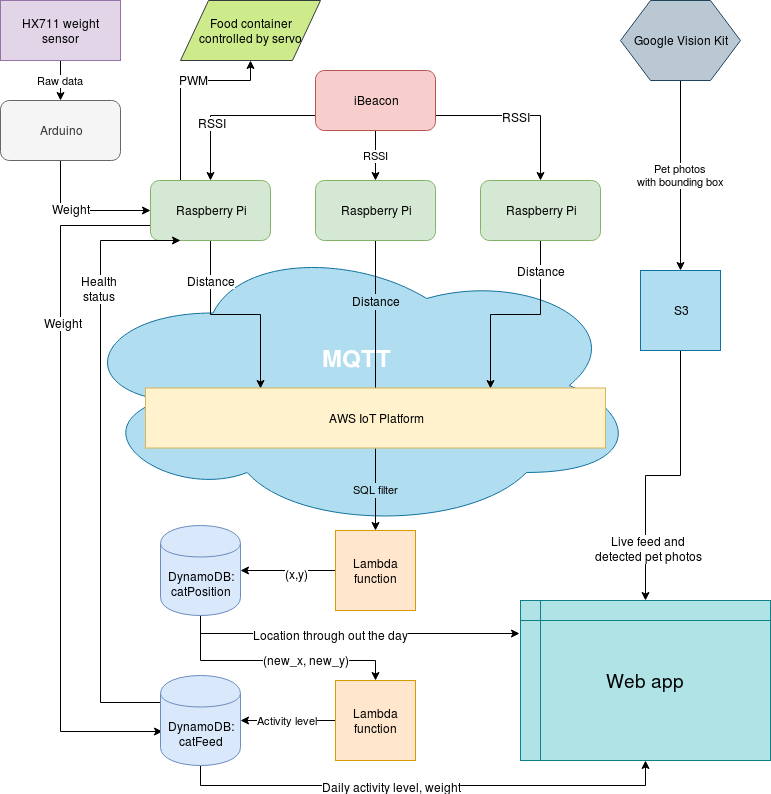
AWS IoT - MQTT implementation
AWS IoT supports MQTT protocol. The scanning stations are set as publishers, AWS IoT platform is set as broker and Lambda function is set as a subscriber. In AWS IoT service console, first create three managed devices with the corresponding security keys. Then download these keys to the corresponding devices (Raspberry Pi scanners). The template code implemented in the raspberry is shown in the appendix. The topic that each device publishes to is set to “IoT/Location”. Then the message event trigger entity is set to be the lambda function. Every time a new message is published to the topic, through a SQL server for data pre-processing, the lambda function will be triggered to do the following action.
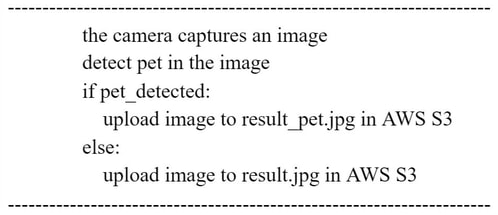
Google Vision Kit
To help the owner have a look at what happens at home, we deployed a Google Vision Kit. We programmed in python with the vision kit's built-in function to detect pet in the image. We connect to AWS with python boto3 and send the image to AWS S3. The code works as:
Web Application
To summarize the information and provide a report to the pet owner, we build a web application to show all data we collect and the conclusion we make. The app uses Node.js as the framework, Semantic UI as the UI framework. The app can be divided into three parts: live camera, pet motion, health report
Live Camera
To let the pet owner know the pet status, we have the Google Vision Kit to take a picture of the room, detects the pet, and sends the image to AWS S3 if the pet is detected. The web app grabs the image from AWS S3 and shows the image to the user. In case the pet in the picture is not detected (it is far away or only part of its body appears in the camera) we also display a live image in our app.
Pet Motion
We take 10 records of the latest 100 seconds data in AWS DynamoDB "CatPosition" table, and draw a plot with Node.js Plotly API. Then we load the plot to the app with a <iframe> tag. One AWS lambda function calculates pet motion from the change of (x, y) every second. The pet is active if the motion at that time is greater than a threshold The result will be updated to DynamoDB "CatFeed" table. At last the web app will show a jumping cat gif image if active, a sleeping cat if inactive.
Health Report
Finally, we need to summarize the result in a report for the pet owner. We store the pet body weight, motion, recommended pet food amount every day in DynamoDB "CatFeed" table. We list that data on our app and make a plot of body weight. If the weight is too low, we show a warning on the web app.
