Localization
For localization, we choose to use three Raspberry Pi scanning stations and one iBeacon tag, and based on the Received Signal Strength Indicator (RSSI), the distance and location of the tag can be calculated relative to the scanners’ locations. In theory, the RSSI value is related to the distance between two nodes and the correspondence follows a one-to-one fashion. However, it is said that the RSSI value can be unreliable sometimes in terms of distance estimation. After some research, we were able to find the official code for distance estimation that is based on the iBeacon protocol. However, during our testing, the localization result was far from acceptable, and the error can be as much as several meters sometimes. Then we have discovered that relation between distance and RSSI value actually varies among different devices, therefore we have decided to do some measurements using our specific devices and use linear regression for approximating the relation between RSSI and distance.
First, we took some measurement of the different distance between the iBeacon tag and the Raspberry Pi station as shown below:
First, we took some measurement of the different distance between the iBeacon tag and the Raspberry Pi station as shown below:
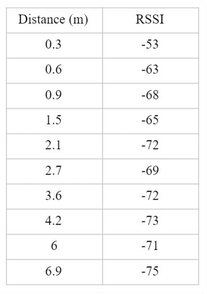
The RSSI value is recorded as the average during the duration of 30 seconds. The recorded RSSI is then saved to a “.csv” file for further data processing.
Then based on these measurements, we have defined a function that approximates the distance based on the RSSI value as shown below:
Then based on these measurements, we have defined a function that approximates the distance based on the RSSI value as shown below:
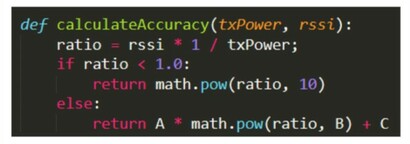
As shown in the function, the ratio of RSSI and txPower is calculated, then the returned value is based on three parameters A, B and C and the distance is calculated as:

We then chose to use linear regression to find out the value of A, B and C. We then tried to test the result of the function, the estimated distance compared to the true distance is as shown below:
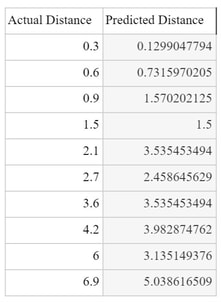
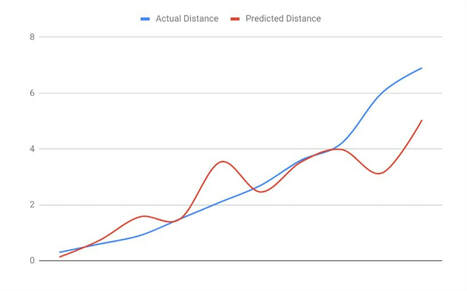
As shown in the graph, the predicted distance was overestimated when the distance is small and underestimated when the distance is larger. Under our further testing using triangulation for calculation the location, we were able to achieve relatively small error when the tag is close to the stations.
Lambda Functions
We have used the AWS Lambda Functions for triangulation based localization and calculation of daily activity level based on the change of location. The function would be triggered whenever a new message is published to the topic “IoT/Location” (AWS IoT - MQTT service has been used for data transmission). Getting the information correctly and linking the event trigger with lambda functions and finally to the DynamoDB database with the output shown in the CloudWatch console was a challenge for us.
We then decided to use two separate lambda functions and two database tables for data processing, with the first one taking in the distance information between the tag and the three scanners and invoking the localization method in order to determine the location coordinate of the tag, and the second lambda function calculates the change in the x,y coordinates to determine the active status and activity level of the pet.
The first lambda function is shown below:
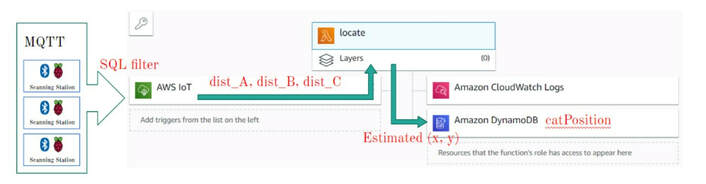
As shown above, the first lambda function takes in the dist_A, dist_B, dist_C value from the AWS IoT platform that corresponds to the estimated distance between the tag to station A, B and C. Then the distance values are passed to a least square error solver as shown below:
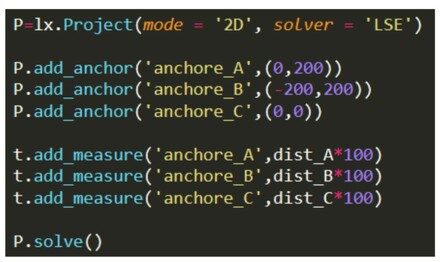
As shown above, the coordinates of the station A, B and C are predefined and the coordinate of the tag can be solved and then is stored in a database called “catPosition”
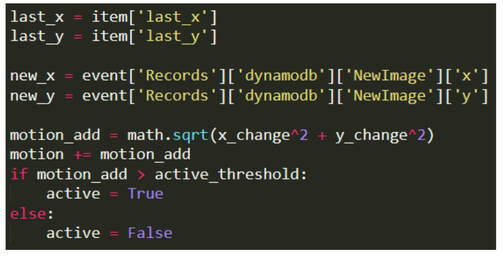
The second lambda function is shown below:
The second lambda function is shown below:
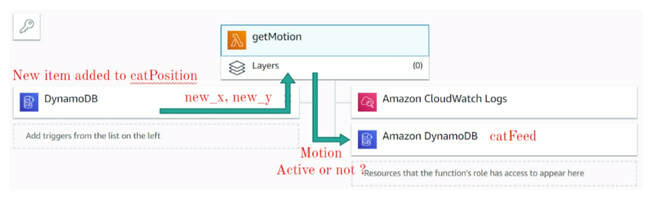
As shown above, the second lambda function would be triggered whenever a new record (new_x, new_y) is added to the “catPosition” database, and the change in x and y can be calculated. If the calculated change in location is larger than a threshold, the pet is determined to be active. The change in location is also incremented to represent the daily activity level of the pet. The pseudocode is attached below: